 1
 2
 3
 4
 5
 6
 7
 8
 9
10
11
12
13
14
15
16
17
18
19
20
21
22
23
24
25
26
27
28
29
30
31
32
33
34
35
36
37
38
39
40
41
42
43
44
45
46
47
48
49
50
51
52
53
54
55
56
57
58
59
60
61
62
63
64
65
66
67
68
69
70
71
72
73
74
75
76
77
78
79
80
81
82
83
84
85
86
87
88
89
90
91
92
93
94
95
96
97
98
99
100
101
102
103
104
105
106
107
108
109
110
111
112
113
114
115
116
117
118
119
120
121
122
123
124
125
126
127
128
129
130
131
132
133
134
135
136
137
138
139
140
141
142
143
144
145
146
147
148
149
150
151
152
153
154
155
156
157
158
159
160
161
162
163
|
initMap(){
const _this = this;
let mychart = echarts.init(document.getElementById("mymap"))
mychart.off('click')
let convertData = function (data) { // 处理数据函数
let res = [];
for (let i = 0; i < data.length; i++) {
let obj = {
device: data[i].device,
companyName: data[i].companyName,
subData: data[i].subData,
value: data[i].value,
type: data[i].type,
}
res.push(obj)
}
return res
}
let convertSeries = [{
type: "effectScatter",
coordinateSystem: "bmap",
data: convertData(_this.normalGroup),
symbolSize: 24,
label: {
show: true,
color: "#fff",
fontSize: 16,
// distance: 0,
formatter: function (item) {
// 散点中心显示数字-公司名下的设备总数
let label = item.data.subData.length + 1;
return label;
},
},
showEffectOn: "emphasis",
hoverAnimation: true,
animation: false,
itemStyle: {
normal: {
color: "#0CB481",
},
},
zlevel: 2,
},{
type: "effectScatter",
coordinateSystem: "bmap",
data: convertData(_this.warnGroup),
symbolSize: 24,
label: {
show: true,
color: "#fff",
fontSize: 16,
distance: 0,
formatter: function (item) {
let label = item.data.subData.length + 1;
return label;
},
},
showEffectOn: "render",
rippleEffect: {
period: 8,
scale: 1.5,
brushType: "stroke",
},
hoverAnimation: true,
animation: false,
itemStyle: {
normal: {
color: "#0D86F5",
},
emphasis: {
color: "#0D86F5",
},
},
zlevel: 3,
}]
let oldTooltip = {
trigger: 'item',
triggerOn: 'click',
enterable: true,
borderWidth: 0,
showDelay: 0,
hideDelay: 0,
transitionDuration: 0,
// 白底黑字
extraCssText: "z-index:100;background:rgba(0,0,0,0.8);color:#fff;padding:0;",
formatter: function(item){
// 重要警告!!!这里使用了formatter返回原生html字符串,使用了大量的字符串拼接操作
// 测试发现这里不支持对象的{}表示方式,所以只能使用[[],[]]二维数组的方式
// 使用了大量单引号双引号和转义符,如果出错一般就是字符串拼接时候引号对应错误
let data = [];
let allPage = item.data.subData.length + 1;
// 将当前页码和总页数存储为二维数组的第一项
// 注意data里每个字段的顺序和展示的tooltip顺序保持一致
let pushArr = [
item.data.device,
item.data.companyName,
item.data.type,
]
data.push(pushArr);
item.data.subData.forEach((element) => {
data.push([
element.device,
element.companyName,
element.type
])
// 每次打开新的tooltip,初始化页码和当前deviceName
_this.tooltipCurDeviceName = data[0][0];
_this.tooltipCurPage = 1;
data = JSON.stringify(data);
let newData = "";
for (let i = 0; i < data.length; i++) {
if (data[i] === '"') {
newData += "'";
} else {
newData += data[i];
}
}
data = newData;
// 使用字符串拼接,根据条件修改原生css
let conditionalCSS = "";
switch (item.data.status) {
case "警告":
conditionalCSS += "style='color:#0D86F5'";
break;
case "正常":
conditionalCSS += "style='color:#0CB481'";
break;
}
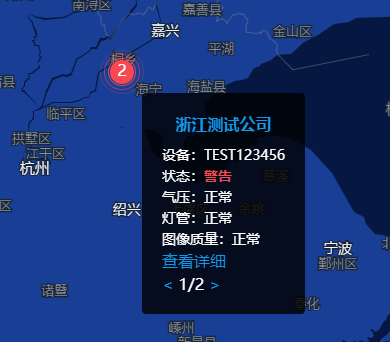
let resultHtml =
`
<div id="tooltipDiv" style="padding: 20px;">
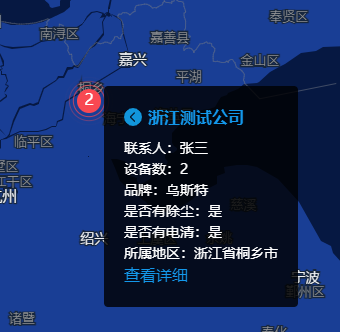
<div onclick="titleClick(${data})">
<span>${item.data.companyName}</span>
</div>
`
+'<div id="statusDiv">状态:<b'
+ conditionalCSS + item.data.status +
"</b></div>";
return resultHtml
}
}
}
let option = {
bmap: {
center: [104.5, 30.8],
roam: true,
},
tooltip: oldTooltip,
animation: false,
series: convertSeries
};
// 每次点击散点的时候 初始化tooltip
mychart.on('click', function (element) {
let tempOption = mychart.getOption()
tempOption.tooltip = oldTooltip
mychart.setOption(tempOption)
})
mychart.setOption(option)
}
|