Featured image of post Vue+ ECharts 实现饼图和折线图联动

Vue+ ECharts 实现饼图和折线图联动

图表联动,封装ECharts,处理后端传递的图表数据

预览效果

联动图

ECharts组件封装

传入指定的 id 、option、宽高,然后渲染图表。

封装 component

 1
 2
 3
 4
 5
 6
 7
 8
 9
10
11
12
13
14
15
16
17
18
19
20
21
22
23
24
25
26
27
28
29
30
31
32
33
34
35
36
37
38
39
40
41
42
43
44
45
46
47
48
49
50
51
52
53
54
55
56
57
58
59
60
61
62
63
64
65
66
67
68
69
70
71
72
73
74
75
76
77
78
79
80
81
82
83
84
85
86
87
88
89
90
91
92
93
94
95
// ehistogram.vue
<template>
  <div>
    <div ref="chart" :id="idName" :style="{ height: height, width: width }" />
  </div>
</template>
<script>

export default {
  name: 'ehistogram',
  props: {
    width: {
      type: String,
      default: '100%'
    },
    height: {
      type: String,
      default: '350px'
    },
    autoResize: {
      type: Boolean,
      default: true
    },
    chartOption: {
      type: Object,
      required: true
    },
    idName: {
      type: String,
      required: true
    },
    type: {
      type: String,
      default: 'canvas'
    }
  },
  data() {
    return {
      chart: null
    }
  },
  watch: {
    chartOption: {
      deep: true,
      handler(newVal) {
        this.setOptions(newVal)
      }
    }
  },
  mounted() {
    this.initChart()
    if (this.autoResize) {
      window.addEventListener('resize', this.resizeHandler)
    }
  },
  beforeDestroy() {
    if (!this.chart) {
      return
    }
    if (this.autoResize) {
      window.removeEventListener('resize', this.resizeHandler)
    }
    this.chart.dispose()
    this.chart = null
  },
  methods: {
    resizeHandler() {
      this.chart.resize()
    },
    initChart() {
      this.chart = this.$echarts.init(this.$refs.chart, '', {
        renderer: this.type
      })
      this.chart.setOption(this.chartOption)
      this.chart.on('click', this.handleClick)
    },
    handleClick(params) {
      this.$emit('click', params)
    },
    setOptions(option) {
      this.clearChart()
      this.resizeHandler()
      if (this.chart) {
        this.chart.setOption(option)
      }
    },
    refresh() {
      this.setOptions(this.chartOption)
    },
    clearChart() {
      this.chart && this.chart.clear()
    }
  }
}
</script>

联动和数据共享

官网提供了实例,但是它是上下布局,并且 dataset 数据和我从后端拿到数据不一样,处理方法相对复杂,所以我没有采用。

初始化数据

 1
 2
 3
 4
 5
 6
 7
 8
 9
10
11
12
13
14
15
16
17
18
19
20
21
22
23
24
25
26
27
28
29
30
31
32
33
34
35
36
37
38
39
40
41
42
43
44
45
46
47
48
49
50
51
52
53
54
55
56
57
58
59
60
61
62
63
64
65
66
67
68
<template>
	<div>
     	<ehistogram idName="pieLineContainer" :chart-option="pieLineOption" :auto-resize="true" height="400px" width="100%"></ehistogram> 
    </div>
</template>
<script>
    import ehistogram from "./components/ehistogram.vue"
    export default {
        components: {
            ehistogram
        },
        data() {
            this.pieLineOption = {
                "legend": {
                    "data": [],
                    "textStyle": {
                        "color": "#fff"
                    },
                    "show": true,
                    "x": "left",
                    "left": "center",
                    "top": "3%"
                },
                "tooltip": {
                    "show": true,
                    "trigger": "axis"
                },
                "grid": {
                    "left": "40%",
                    "right": "5%",
                    "top": "25%",
                    "bottom": "10%",
                    "containLabel": true
                },
                "xAxis": {
                    "type": "category",
                    "axisLabel": {
                        "show": true,
                        "textStyle": {
                            "color": "#fff"
                        }
                    },
                    "axisTick": {
                        "show": false
                    },
                    "data": []
                },
                "yAxis": {
                    "type": "value",
                    "axisLabel": {
                        "show": true,
                        "textStyle": {
                            "color": "#fff"
                        }
                    },
                    "axisLine": {
                        "show": false
                    },
                    "axisTick": {
                        "show": false
                    }
                },
                "series": []
            };
            return {
                pieColors: ['#69D2E7', '#AAB3AB', '#61a0a8', '#d48265', '#A8E6CE', '#FF9933', '#C2C287'],
            }
        },

数据处理和图表渲染

 1
 2
 3
 4
 5
 6
 7
 8
 9
10
11
12
13
14
15
16
17
18
19
20
21
22
23
24
25
26
27
28
29
30
31
32
33
34
35
36
37
38
39
40
41
42
43
44
45
46
47
48
49
50
51
52
53
54
55
56
57
58
59
60
61
62
63
64
65
66
67
68
69
70
71
72
73
74
75
76
77
78
79
80
81
82
83
84
85
86
87
    mounted() {
        this.handleData()
    },
    methods() {
		handleData(){
			//从api获取你需要的真实数据 此处就直接赋值了
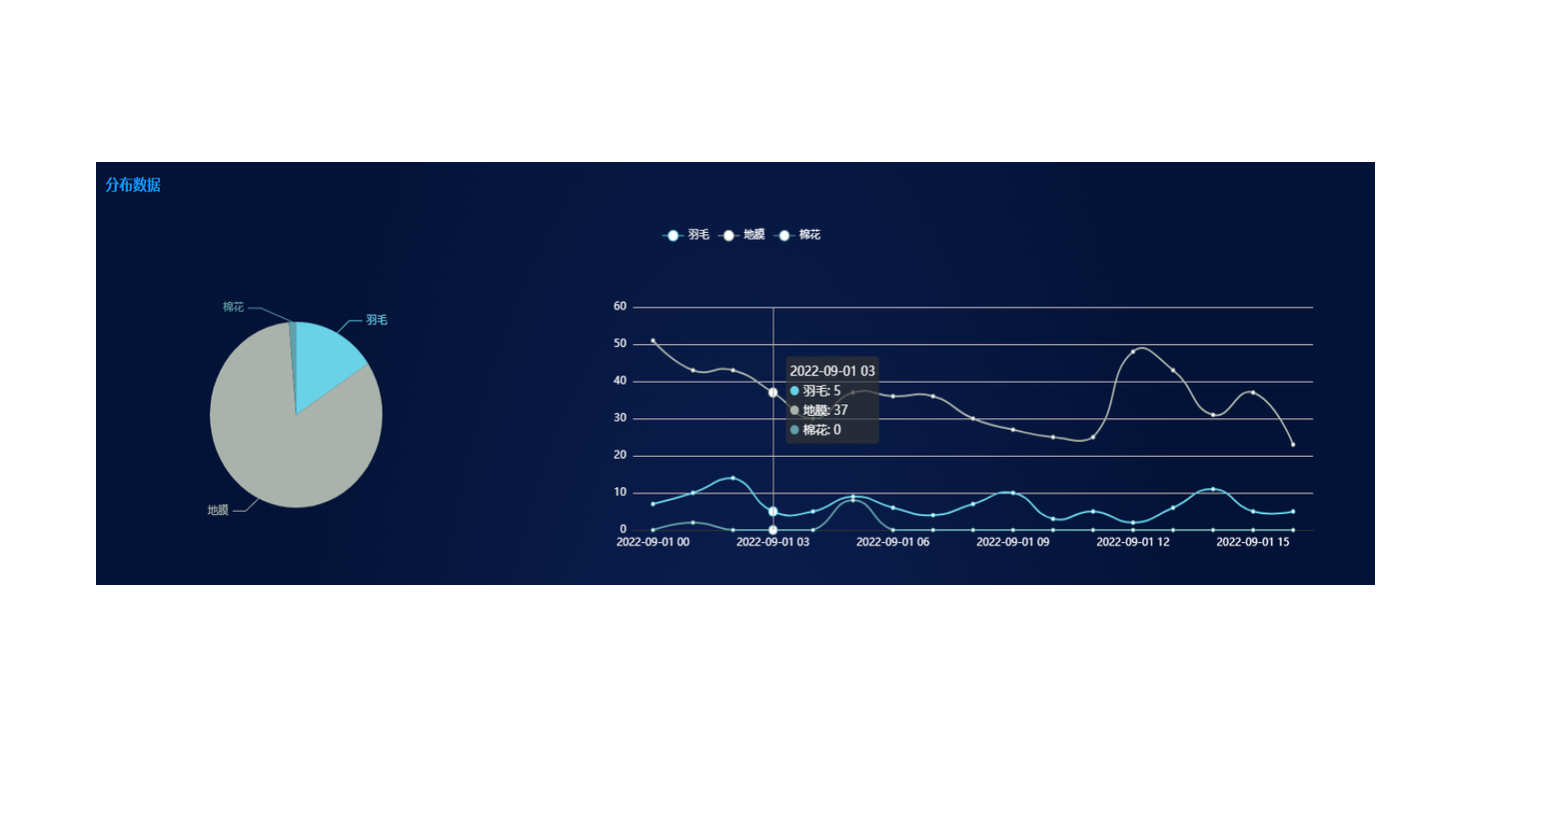
			let xAixsData = [
                        "2022-09-01 00",
                        "2022-09-01 01",
                        "2022-09-01 02",
                        "2022-09-01 03",
                        "2022-09-01 04",
                        "2022-09-01 05",
                        "2022-09-01 06",
                        "2022-09-01 07",
                        "2022-09-01 08",
                        "2022-09-01 09",
                        "2022-09-01 10",
                        "2022-09-01 11",
                        "2022-09-01 12",
                        "2022-09-01 13",
                        "2022-09-01 14",
                        "2022-09-01 15",
                        "2022-09-01 16"
                    ];
			let legendName = [
                        "羽毛",
                        "地膜",
                        "棉花",
                    ];
			let line1 = [7,10,14,5,5,9,6,4,7,10, 3,5,2,6,11,5,5];
			let line2 = [ 51,43,43,37,30,37,36,36,30,27,25,25,48,43,31,37,23];
			let line3 = [0,0,2,0,0,0,0,0,0,0,0,0,8,0,0,0,0];
			let lineObj = [line1, line2, line3]

			let allSum = [{
                "name": "羽毛",
                "value": 114
            },
            {
                "name": "地膜",
                "value": 602
            },
            {
                "name": "棉花",
                "value": 10
            }]

			let seriesTemp = []
            for (let i = 0; i < legendName.length; i++) {
                let objLine = {
                    name: legendName[i],
                    type: "line",
                    color: this.pieColors[i],
                    smooth: true,
                    data: lineObj[i]
                }
                seriesTemp.push(objLine)
            }

            let pieObj = {
                name: "总数",
                type: 'pie',
                color: this.pieColors,
                center: ['15%', '54%'],
                radius: '50%',
                data: allSum,
                label: {
                    formatter: (params) => {
                        return params.name + ':' + params.value
                    }
                },
            }
            seriesTemp.push(pieObj)

			this.initChart(xAixsData, legendName, seriesTemp)
		},
        initChart(xAixsData, legendName, seriesTemp){
			this.pieLineOption.xAxis.data = xAixsData
            this.pieLineOption.legend.data = legendName
            this.pieLineOption.series = seriesTemp
			this.pieLineChart = this.$echarts.init(document.getElementById('pieLineContainer'));
            this.pieLineChart.setOption(this.pieLineOption);
		}
    }
}
</script>
Built with Hugo
Theme Stack designed by Jimmy